


In January 2019 IESE researchers visited Stockholm to discuss with partners the economic evaluation of the measures implemented. The partners were also able to have a chat with KTH researchers about the technical evaluation. After this meeting the general feeling was that it is possible to evaluate the measures technically, economically and socially with the available data. IESE researchers also discussed the upscaling of measures and their replicability, which are an important part of this project. In this blog I will elaborate a little bit on the evaluation of measures in work packages 2 and 3 where evaluation data is available.
Action area 1: Low-Energy Districts
What is happening in Valla Torg, Årsta and the Slakthus area buildings, what results do we have and what can be scaled-up?
In Valla Torg the refurbishment and implementation of energy efficient measures of the final two multi-storey buildings (2A and 3B) and the low-storey building 5E are finalised. Tenants have moved in to buildings 2A and 5 E and will move in to building 3B in March. The reductions in energy use based on the evaluation this far was as follows:
| BUILDING 6F | Area size | Energy purchased | Energy produced locally | Energy use |
| Before refurbishment | 4942 m² | 650 510 kWh | 132 kWh/m² | |
| After refurbishment | 5191 m² | 193 162 kWh | 4 276 kWh (new photovoltaics installed) | 38 kWh/m² |
| Total energy use reduction | 94 kWh/m2 or 72% |
In Building 6F the total reduction in consumed energy was thus 94 kWh/m2 thus 72%.
| BUILDING 7G | Area size | Energy purchased | Energy produced locally | Energy use |
| Before refurbishment | 4571 m² | 568 136 kWh | 124 kWh/m² | |
| After refurbishment | 4626 m² | 370 578 kWh | 11 493 kWh (new photovoltaics installed) | 83 kWh/m² |
| Total energy use reduction | 44 kWh/m2 or 36% |
In Building 7G the total reduction in consumed energy was 44 kWh/m2 (36%). These figures are lower than expected, but they are largely due to the fact that the exhaust air heat pumps were not functioning before December 2018. The estimation for 2019 with fully functioning heat pumps is a reduction of 64% in consumed energy.
| BUILDING 8H | Area size | Energy purchased | Energy produced locally | Energy use |
| Before refurbishment | 5401,5 m² | 688 049 kWh | 127 kWh/m² | |
| After refurbishment | 5651 m² | 415 170 kWh | 3087 kWh (new photovoltaics installed) | 74 kWh/m² |
| Total energy use reduction | 53 kWh/m2 or 42% |
In Building 8H the total reduction in consumed energy was thus 53 kWh/m2 (42%). These figures were also lower than expected, but they were also largely due to the fact that the exhaust air heat pumps were not functioning before the end of November 2018. The estimation for 2019 with fully functioning heat pumps is a reduction of 66% in consumed energy.
If the estimated values for buildings 7G and 8 H are reached the average energy use per squaremeter in the first three evaluated buildings is 42 kWh/m2. These are very promising results, considering that the original building is from 1961 and that the requirement for new-built buildings in Stockholm is 55 kWh/m2.
As the results indicate, the technical solutions are indeed able to reduce the energy use in an old residential building by more than 70%, but it is economically feasible? We do not yet have the economic figures, so unfortunately it is too early to define if the refurbishment is economically feasible or not. I should be able to answer this in the next blog in May. There are other issues to consider. One of these issues is the u-value of the windows. The windows chosen in the project have a very low u-value of 0,7. In our northern climate this low u-value has meant that during special weather conditions more than half of the window has had frost on the outside. The frost indicate that heat is not leaking out the window, but for the tenant it is inconvenient when they cannot look out the window.
In the private condominia Brf Årstakrönet the evaluation is on its second year. Compared to the 2015 baseline, the savings in 2018 was around -11% for district heating -13% for electricity (not including electricity used in apartments) and -3% for water.
In Slakthus-area the refurbishment of building 8 is finalised. Compared to the 2017 baseline, the savings in 2018 were 49% for district heating. The baseline for electricity in 2017 is not comparable with the 2018 use as the function of the building has changed becoming amusic club which resulted in an increased use of electricity of 300% .
The substitute building Kylhuset in Slakthus-area is also finalised for building related energy efficiency measures. Compared to the 2017 baseline, the savings in 2018 were 19% for district heating and 10% for building electricity. The production of electricity from photovoltaics is not available yet 2018, nor the recovery of waste heat from the datacentre. These do not affect the above figures, but they do affect the saving in total CO2-emissions.
Action area 2: Integrated Infrastructures
Installing smart LED-lighting
The smart LED-street lights (solution 5) have now been in operation for more than two years and the system works well. There are three sub-measures implemented and evaluated. I presented the results in my previous blog post but in summary the savings are between 14 and 46% depending on the sub-measure. The economic evaluation is not yet available, but in my next blog I will be able to talk more about the economic feasibility of this measure.
A Smart, Connected City
The aim of the measure 5.2 is to implement in the city environment, if possible on existing infrastructure, sensors for data collection, analysis, visualization.
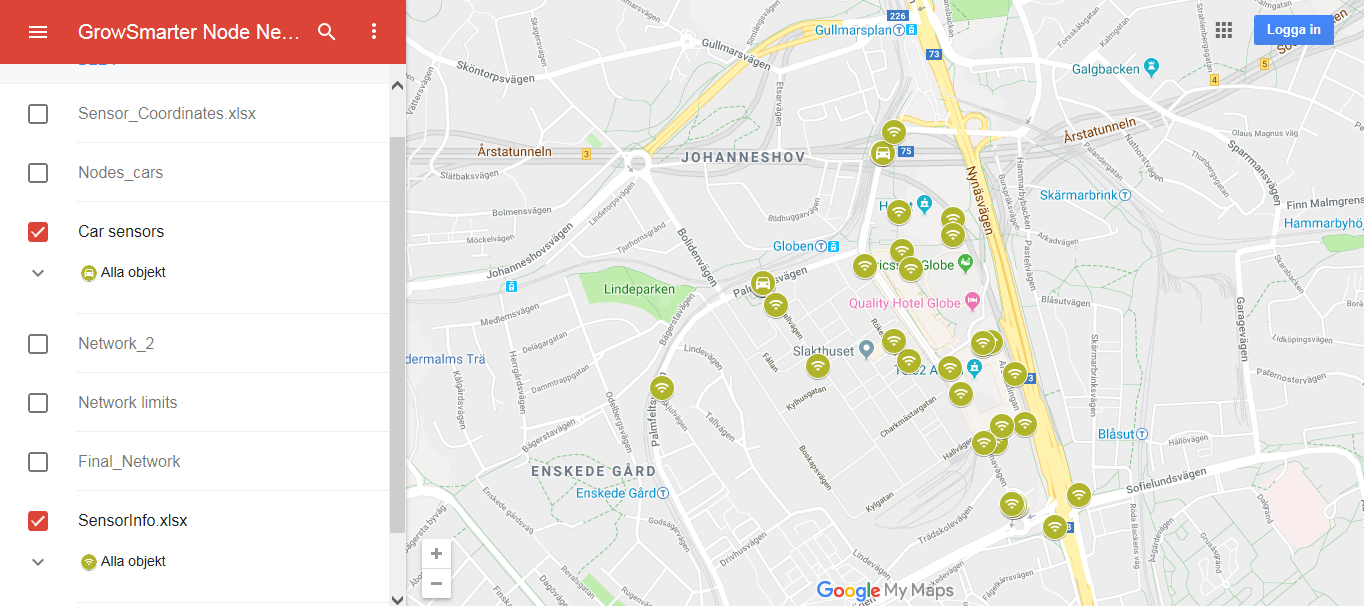
Two types of sensors have been implemented in the Slakthus-area and have been operating for one year. The 10 sensors for measuring vehicle traffic on a real-time base have been functioning well and have provided accurate data. Some of the sensors were installed in existing infrastructure (a bridge, existing road signs), whereas others were installed on poles specifically set up for that purpose, as neither the traffic or light poles could bear their weight. As it is costly to install the poles, bring electricity and connectivity to them, it is important that the sensors can operate for a long period of time. Therefore we are currently working on extending the measurement time beyond the project time.
The wifi-nodes were installed in buildings owned by the city and could use the existing connectivity (broadband) there. No additional cabling for electricity was needed as the wifi-nodes were connected with power over Ethernet (PoE). Theywere supposed to detect passing people in a very accurate way, but in reality did not do so. The issues were the sensitivity of the sensors, that regularly stopped working and the connection to people’s mobile device which was too long (between 20 seconds and 3 minutes) to determine if people were pedestrians, cyclers, or passing in a car.
We are currently going through all wifi-nodes not providing data to re-start and/or replace them. We also add new wifi-nodes to provide additional data. And as a third step IBM is installing multisensors to gather additional data about pedestrians and bicyclists in the Slakthusarea, as part of M8.1.
The data from the sensors are analysed and visualised in the IOT platform provided by IBM. In the platform we have information about all sensors as well as a map (see below).
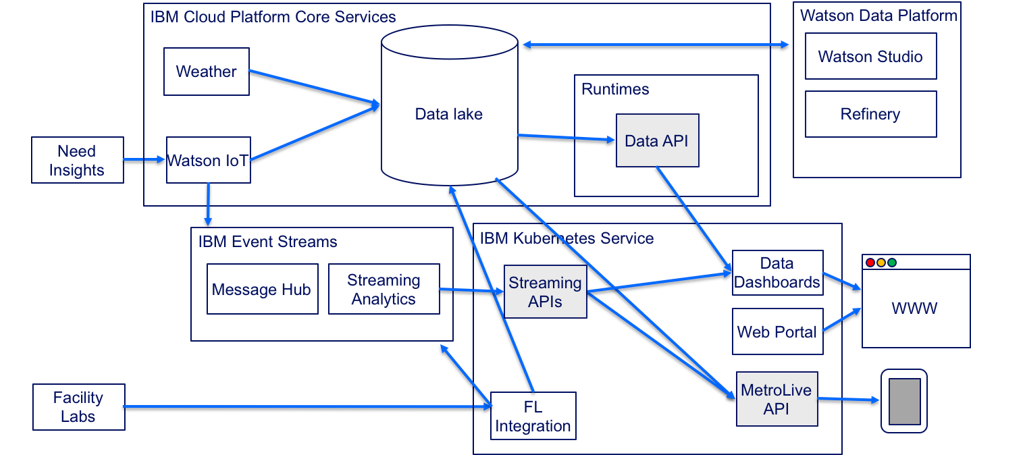
IBM, who is responsible for the open consolidated big data platform (solution 8), has built up a multi-use data platform where real-time data can be analysed, but also were the data can be turned into practical usecases on reducing transport emissions and increasing the quality of life for citizens. Data flows from the sensor vendors’ systems via two separate entry points. The data is then immediately stored in the data lake for later processing but also fed online via the IBM Event Streams system for online processing, e.g. real time counting of unique visitors, or passages through the system.
Implementation of a Big Data platform often impose a higher start-up cost for the first use case. Adding additional cases or increasing the usage of the same use case can lower the cost per unit of use case. This effect is basically a result of services or labour costs. The IT related platform cost (IBM Cloud) is consumption based and will have a low cost for the low volumes also at the start.
The Measure is economically sustainable when we assume that the foundation would be used for more cases or at a larger scale. The Measure is installed in a limited geographical area with few sensors connected which makes the relative cost per sensor higher.
Waste Heat recovery
Fortum’s open district heating (solution 6) system has two sub measures. The first sub measure is “waste heat recovery from data centers”. The data center is now having a load of 0,54 MW heat and will annually generate approx. 4,7 GWh (based on 8760 hours of operation/year) of heat. The heat reuse of the data center is expected to increase gradually to a level of approximately 1MW heat, a heat recovery that is sufficient to heat more than 1,000 apartments while reducing annual CO2 emissions in Stockholm. From the technical perspective, the main innovative solution applied to the data center is the heat pump model used, which is the first of its kind in Sweden. The heat pump is able to produce hot water at a temperature of 85oC instead of around 68oC. This is an advantage since a higher delivery temperature allows for more running hours in the district heating system, also during cold days when district heating customer SLA requires temperatures above 68C.
This measure has been economical feasible for both the district heating company Stockholm Exergi and the supplier. For Stockholm Exergi the recovered heat has been cost efficient compared to other production units. For a large-scale implementation of heat recovery into the district heating network Stockholm Exergi gains in other aspect such as avoiding peak production capacity investments and reducing operation and maintenance costs thanks to third party ownership of the production asset. For the data center, heat recovery generates a revenue stream from the waste heat that otherwise would be costly to get rid of. Since the datacenter had expansion plans there was an investment need in more cooling capacity. Instead of another conventional cooling machine, this heat pump solution with heat recovery was chosen. If you compare these two options this measure shows economical gains for the supplier compared to conventional data center cooling. Pay-back for the supplier will be within 5 years time but the economical values will remain over the total technical lifetime of approximately 15-25 years.
The second sub measure is “waste heat recovery from fridges and freezers in supermarkets”. The studied supermarket had a heat recovery potential of up to 30 kW which would approx. generate 219 MWh annually. As long as the measure was in operation, during January to August 2017, the running time was over 99%, way higher than the initial aim of 50%.
The conclusions regarding the sustainability of this measure shows that implementing heat recovery will contribute to decreasing the use of fossil fuels and carbon emissions independently of the electricity mix used when calculating the footprint.
The economic feasibility of this measure could not be adequately evaluated due to the lack of data caused by the limited time of operation. The pay-back period for the supplier is estimated to be within 10 years’ time but the generation of economical value would continue over the equipment’s total technical lifetime of approximately 15-25 years.
Smart waste handling
The waste handling system provided by Envac has been running since summer 2017. This solution demonstrates a smart waste solution for residential areas using differently coloured bags for different sorts of waste, transporting the bags long distance underground and sorting them automatically in a treatment plant. There are currently six inlets in operation in the installation due to the general time plan of the refurbishment of the Valla torg site. When the automated waste collecting system is in full operation there will be 13 inlets, thus increasing the amount of waste significantly, in turn making the evaluation more relevant.
There is no data available for the sorting rate prior to the installation of the automated waste collecting system, so the sorting rate is compared to reference values from the Optibag sorting facility in the city of Eskilstuna, see table 1. Notably the residents in Årsta sort their waste better the residents of Eskilstuna. There is less rest fraction and more of organic fraction and paper packaging, even though there is slightly less plastic packaging. This is a good sign, since there were no sorting of organic waste prior to the installation of the AWCS in Årsta.
| Fraction | Årsta 181122-181212 | Eskilstuna reference values (source : Envac Optibag AB) |
| Rest fraction | 41% | 52% |
| Organic fraction | 41% | 34% |
| Plastic packaging | 6% | 8% |
| Paper packaging | 13% | 7% |
The organic fraction can be used for biogas production, which in turn can be used in vehicles. So it is very promising that this fraction per quantity is the largest.
A normal consequence of the installation of an AWCS from Envac is a substantial reduction of waste truck traffic in the area. This is also the result for the Growsmarter installation in Årsta/Valla Torg. The traffic in the area is reduced by 90%.With the available information the measure seems to be financially sustainable, if the present revenues are maintained along the life time of the asset.
As the evaluation of measures in workpackages 2 and 3 shows, we do have some interesting results and measures which have a great potential for replication both in Stockholm and in other European cities. We will return to WP4 measures as well as WP2 economic evaluation in the next blog when I have this data available.
With this I wish you a pleasant and sunny spring.
 Mika Hakosalo
Site Manager, Stockholm
For the previous blog post, click here